
Health And Productivity Management Sustainability
Health And Productivity Management
We promote health and productivity management to achieve the highest level of our management philosophy, namely Customer Satisfaction, Investor Satisfaction, and Employee Satisfaction[A1.1], and to improve them in a sustainable manner. We strive to create a workplace where every employee can maintain both physical and mental health, work with peace of mind, and find purpose and fulfillment in their work. We value the well-being of our employees and their families and support them in leading healthy lives with smiles. We are committed to promoting health and wellness initiatives that enable employees to enjoy healthy and enriched daily lives.
※Customer Satisfaction, Investor Satisfaction, Employee Satisfaction
Naoki Ito
Representative Director of the Board, President & Corporate Officer
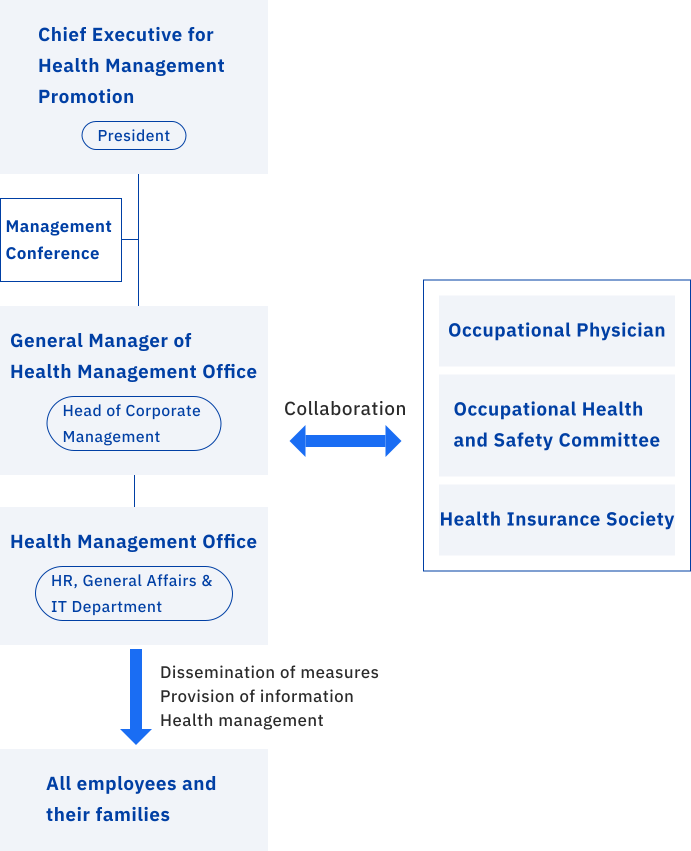
Promotion Structure
Health Management Strategy Map
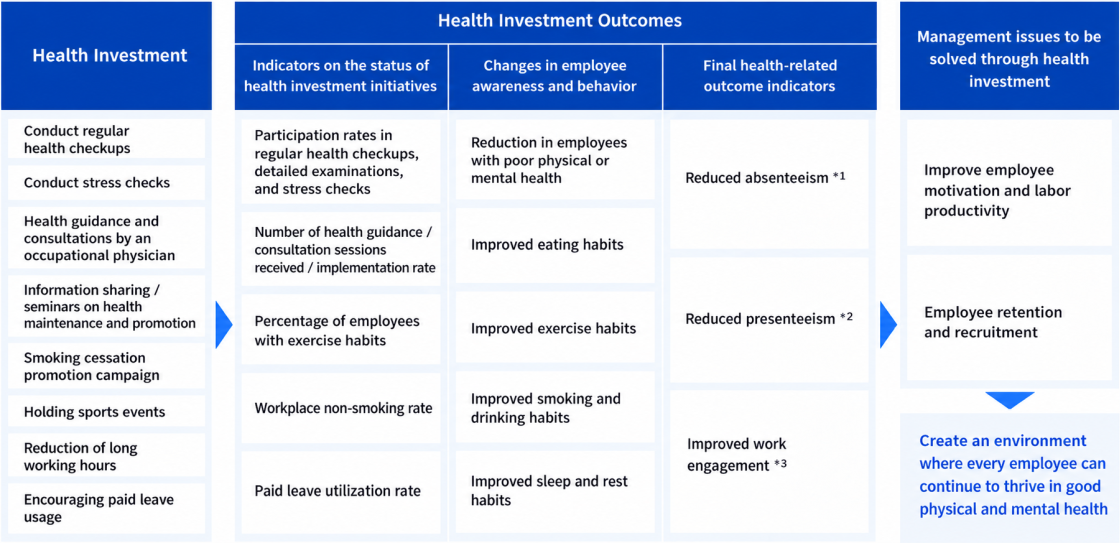
※1 A state in which an employee is unable to perform work due to taking leave caused by physical or mental health issues.
※2 A state in which productivity at work has declined due to physical or mental health issues.
※3 A sense of fulfillment in one's work and a sense of unity in the workplace.
Targets and results
Health checkup participation rate (%)
| FY2023 | FY2024 | FY2025 | FY2026 Goals | |
|---|---|---|---|---|
| Regular health checkup participation rate | 100 | 100 | 100 | 100 |
| Stress check survey participation rate | 72.0 | 76.0 | 82.9 | 100 |
Percentage of employees requiring follow-up for lifestyle-related health indicators (%)
| FY2023 | FY2024 | FY2025 | FY2026 Goals | |
|---|---|---|---|---|
| Obesity (BMI) | 38.3 | 40.8 | 41.1 | 26% or less |
| Liver function | 22.4 | 19.5 | 21.0 | 16% or less |
| Lipid levels | 34.2 | 35.8 | 35.1 | 37% or less |
| Blood glucose | 12.1 | 10.3 | 11.2 | 10% or less |
| Blood pressure | 10.5 | 9.2 | 10.9 | 16% or less |
Employee health indicators (%)
| FY2023 | FY2024 | FY2025 | FY2026 Goals | |
|---|---|---|---|---|
| Percentage of employees requiring follow-up in regular health checkups | 63.5 | 61.9 | 60.6 | 63% or less |
| Percentage of employees identified as high stress | 25.8 | 29.1 | 23.4 | 15.5% or less |
| Percentage of employees maintaining an appropriate body weight (BMI) | 57.0 | 54.6 | 54.2 | over 60% |
Lifestyle indicators (%)
| FY2023 | FY2024 | FY2025 | FY2026 Goals | |
|---|---|---|---|---|
| Exercise | 31.0 | 30.5 | 29.2 | over 28% |
| Sleep | 57.7 | 57.6 | 53.3 | over 63% |
| Alcohol consumption | 88.6 | 90.3 | 90.2 | over 84% |
| Smoking (nonsmoking rate) | 62.7 | 63.8 | 65.7 | over 75% |
Definitions of lifestyle indicators
Exercise: Engaging in exercise that induces light perspiration for at least 30 minutes per session, at least twice a week, for one year or longer
Sleep: Obtaining sufficient rest through sleep
Alcohol consumption: Maintaining at least two alcohol-free days per week
Smoking: Nonsmoking (reduction in smoking rate)
Average paid leave utilization rate (%)
| FY2023 | FY2024 | FY2025 | FY2026 Goals | |
|---|---|---|---|---|
| Average paid leave utilization rate | 62.9 | 63.4 | 61.4 | over 65% |
※ Paid leave utilization rate is calculated using the formula: Total days of paid leave taken / Total days of paid leave granted × 100
Average paid leave utilization rate (%)
| FY2023 | FY2024 | FY2025 | FY2026 Goals | |
|---|---|---|---|---|
| Employee turnover rate | 5.21 | 5.10 | 6.30 | 4.0 or less |
Average monthly overtime hours (hours)
| FY2023 | FY2024 | FY2025 | |
|---|---|---|---|
| Average monthly overtime hours | 14.4 | 12.1 | 14.5 |
Absenteeism
| FY2023 | FY2024 | FY2025 | FY2026 Goals | |
|---|---|---|---|---|
| Number of employees on leave due to personal illness or injury (persons) | 7 | 3 | 1 | 1 or less |
※ Number of employees on leave due to personal illness or injury for 30 days or longer
Presenteeism
| FY2023 | FY2024 | FY2025 | FY2026 Goals | |
|---|---|---|---|---|
| Labor productivity loss rate (%) | 26.8 | 24.9 | 28.3 | 15% or less |
※ Calculated using the Single-Item Presenteeism Question (SPQ) scale based on a survey conducted among all employees in Japan (434 eligible respondents; response rate: 76.0%).
Health and wellness initiatives
Self-care seminars and mental health training for line managers
As part of our efforts to maintain and improve mental health care, we distributed a self-care seminar video[A6.1]s to all employees and provided mental health training for line managers.

NICHIDAI Sports Day
To encourage employees to develop regular exercise habits, we held a sports
event in which their family members could also participate. The event
included an exercise workshop and a basic fitness assessment, providing
participants with opportunities to better understand their own health
conditions and maintain and promote health together with their family
members.
(Participant satisfaction score: 4.87 out of 5.00)

Smoking cessation seminar video
To raise awareness of smoking cessation among employees who smoke, we distributed a smoking cessation seminar video[A8.1]s aimed at reducing smoking rates among employees.

Dialogue at the Occupational Health and Safety Committee meetings
To examine the direction of initiatives and specific measures from both medical and workplace perspectives, we regularly exchange opinions with the occupational physician and employee representatives at the Occupational Health and Safety Committee meetings.

Health & Productivity Management Organization
To help protect the global environment and contribute to a sustainable future, we installed solar panels at our main domestic and overseas production factories. These installations contribute to reducing CO2 emissions and enable the use of clean, renewable energy.

